Having been lucky enough to attend the huge (*) Tableau #data15 conference a couple of weeks ago – and by now managed to recover mostly – I have noted down some information from the keynote presentation and beyond of what features are likely to appear in nearby versions of Tableau. Any errors are of course of my own doing…it was a tiring week- plus them being features “in development” means Tableau makes no absolute promises as to what will actually end up included.
Most of these features were live-demoed so are presumably fairly far along in the development pipeline. Some are to come in version 9.2 within probably a few weeks; the bulk in future versions – one imagines version 10 sometime late next year. After a couple of conversations, I have marked with “9.2?” those features that seem likely to be in 9.2, but I understand that nothing is set in stone, so stuff may change before release.
The features were divided up into 6 main categories; improvements to:
- Data
- Visualisation
- Analysis
- Self-service
- Dashboards
- Mobile
Data
- Improvements to the automatic data cleanup feature recently released that can import Excel type files that are formatted in an otherwise painful way for analysis. Here’s an example that was auto-interpreted correctly into a single tall table. (9.2?)

- Can now understand hundreds of different date formats. They had trawled Tableau Public to see what was being used and managed to work out how to handle most/all of them. The relatively recent DATEPARSE command in Tableau was/is indeed fantastically useful – but perhaps in the future we won’t need it so often.
- The Data Source screen will now allow Tableau to natively “union” data (as in SQL UNION), as well as join it, just by clicking and dragging. This will help speed up a lot of users’ data preparations I’m sure and eliminate the more basic use of the custom SQL option too perhaps.
Today’s custom SQL option has caused a little confusion in recent times in my experience as the newish Excel connector does not support it (but you can always use the legacy one instead, at least on Windows machines). - Cross-database joins: another potential game-changer; creating “proper” joins (i.e. not blends) from tables on different databases or even database technologies. An example of someone joining a SQL server to an Excel table was shown if I recall correctly. This might reduce the need for a lot of preprocessing or data duplication, which is done today either on the IS side or using other analyst ETL type tools.
Visualisation
- Enhancements to the text table visualisation, particularly to exclude totals from any heatmap and optionally move totals to the top of the table. It sounds like simple stuff, but there’s a lot of “why can’t I do it in Tableau given it’s so easy in Excel” text table type stuff that one hears going around, especially amongst novice users and those consumers as-yet unversed in the benefits of less textual data viz. I can’t imagine using this all that much, but there are certainly occasions where nothing beats a text table, so more options are always welcome. (9.2?)

- Data highlighter: search and highlight particular points on charts interactively. For instance if you have a scatterplot showing 1000 customers, then you can type in the name of one of them and it will show up, without having to play around with complicated filtering workarounds. Can do interactive substring matching.

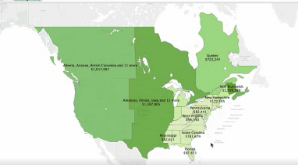
- New native geospatial geographies: a bunch of new granular postcode level geocoding information – I think polygon – data for 76 countries. Great for those of us without a pure US focus. (some in 9.2?)
- A connector to allow connection to spatial data files – .SHP etc. These files, usually output by GIS tools, are a way to represent any custom geographic shapes. Various clever people (many from the Information Lab) have worked out ways to replicate this type of functionality in Tableau or with the help of external tools like Alteryx – but a native import will make life much easier, and hopefully faster.

- Custom geographic territory creation: perhaps your sales territory consists on a hand-selected bunch of postcodes. You could visualise this using a shapefile as per the previous bullet – but you will also be able to interactively define them within Tableau itself.
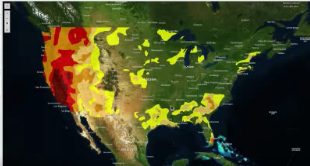
- Integration with Mapbox: the use case shown was to allow custom map backgrounds to use, including a satellite view. (9.2?)
- Tooltips can now contain worksheets themselves – “viz within a viz”. Very popular with the crowd, and I’m sure some amazing uses of this will be developed quickly – perhaps highlighting a customer on your sales chart will show a quick preview of their history with your company as an obvious example. People have developed cunning workarounds to enable this in the past (here for example), but all were something of a limited faff, so native functionality like this should be widely used.

Analysis
- Automatic outlier detection – use the analytics pane to request that Tableau highlights which of your data points are statistical outliers, either by a default set of variables or by ones you specifically select. I didn’t catch any details of which algorithm they were using for this featureOf course you could always easily exclude datapoints by eye if you dared, or use the version 8.1 R integration to do it very comprehensively if you happened to be in the relatively small segment of Tableau users who also knew some R – but this seems so easy now that it will hopefully be used – and used correctly! – by the masses.
- Similarly, automatic cluster detection. A later session explained that it’s an implementation of the K-means algorithm for now (although they are considering adding other clustering functions in future if demand is there – the advanced analytics audience seemed rather more interested in neural networks and Python integration though when it came to giving feedback to a Tableau speaker).It will automatically detect a sensible number of clusters too, making it even easier to use – although I believe this is configurable, as are the variables to consider in clustering.Like the outlier detection, this was relatively very hard for the novice analyst to pull off in Tableau, usually requiring the R integration (which itself requires basic R code knowledge) or external tools. It also happens to be amongst my favourite types of analysis so very pleased to see this sort of advanced analytics functionality being built in such thatit’s very interactive and 1-clickish.

I do hope and trust that it will be possible to get the formal description of the clustering calculations (as it is in the current trending and forecast analytics in Tableau) for those of us who are interested. And let’s hope the online help is up to scratch on explaining appropriate or otherwise uses of these tools! But great to see the analytics pane getting lots of new options, as well as making existing ones easier to find.

- You can “use” reference lines / bands now for things beyond just static display – for example as filters, or to colour marks.
Self service
Lots of Tableau Server stuff, which I assume will also come to Tableau Online in due course.
- There will be a custom server homepage for each user, showing their favourites, most used, etc. analysis workbooks.

- There will be analytics on the workbooks themselves – for instance if you search for “sales” you can see which of the resulting sales analysis workbooks are most used, or opened most recently and so on.

- Searching will become better, with improved results including mini previews.
- Version control – this pleased the crowd a whole lot!! You will be able to revert changed on published workbooks in the common case that someone else (or you) accidentally break something important.
- Improvements to security UI, including an ability to lock project permissions so that everything in the project can only have the permissions an admin assigned to that project. Right now, files can default to their project permissions but it is possible for the analysis author to override this on a single file basis. This has pros and cons, but it’ll be a useful option for many admins I expect. (9.2?)
- A web interface for managing the Tableau server itself.

Dashboards
- Improvements to web editing – most notably that you can now edit and create dashboards (not just worksheets) purely through a web browser (without a desktop license…although the experience will surely remain nicer and richer in the desktop tool if you’re a heavy user) (9.2?).

- Global formatting – ensure all fonts in a workbook are consistent for example.
- Cross database filtering – Tableau can already do cross sheet filtering with a couple of clicks, but only if the data on the sheets comes from the same place. Like the cross-database joins mentioned near the start, you’ll now be able to have one sheet in a dashboard filter another sheet on something mutual, even if they come from totally different databases. This should lead to a lot of interactivity improvements, and fewer faffy parameter workarounds.
- Device preview: whilst developing on Tableau desktop, get an exact preview of how your dashboard will look like on a phone or tablet.
- And then the next logical step: device specific dashboards. Within one file, create different versions of a single dashboard which will then render depending on which type of device the viewer accesses server with. For example, perhaps some charts simply won’t work on small screens, in which case you can tell it to only display that part of a dashboard if a user is not on a phone.

Mobile:
- …in fact the user is more likely to be on a phone as it happens, as there is already a Tableau iPhone app in beta testing (to join the Tableau iPad app). Built with a bunch of finger friendly bits and pieces, and an offline mode (9.2?).

- Not to mention a brand new iPad app – Vizable. Downloadable already for free from iTunes. This is a totally separate product from Tableau proper (for now…) and is designed to allow simple analysis of data in a way that is enjoyable for even the much less hardened analyst. We’re not quite at Minority Report level stuff, but that’s the way it’s heading, with lots of interactive swiping, animations and so on. Right now it seems restricted to data locally stored on your iPad (for instance opened via Dropbox) but you can imagine a day where it could perhaps connect to a Tableau server or beyond.
Here’s a promo video:
and a less musical video showing how it actually works in practice:
Any missing features?
Well, the Tableau community of ideas is always chock full of exciting ideas to the point that there can be no way that every user demand could ever be met. However the above set of new features are in general improvements and new abilities much appreciated by me, both in their specifics and in the sense that they show the direction the product is evolving as ever more resources are put into Tableau’s R&D.
The one big feature I have heard requested in my immediate vicinity that was not mentioned at all was “data driven alerting”.
Tableau server can already email you a given analysis every Monday at 9am for instance. However, people who get weekly emails that they only sometimes care about tend to delete them unopened. Data driven alerting would provide the feature to “only email me if my sales figures are below a certain threshold” or “email me if there is no data in my report” or similar, i.e. ensuring that your email inbox is only filled when there is specifically something urgent to note.
There was no mention of this in the keynote.. In one session later in the week a Tableau employee did mention that work (or at least planning) was taking place within the company considering that topic – but that there is nothing concrete to show or promise yet. Such a feature might therefore come to Tableau in the future, but probably not very quickly, and in an unknown form.
However, I did see a few third-party solutions that try to bring this feature to Tableau non-natively right now – which may be the subject of another post soon.
(*) huge seems a fair description – apparently about 10,000 analysts were there, and the sheer size of it meant it wasn’t possible to attend nearly all the most desirable sessions or meet any sizeable proportion of attendees in detail – but what I did attend was pretty spectacular in general.

One thought on “Future features coming to Tableau 9.2 and beyond”